Customer research
What to do when you do not have enough traffic to test
When conventional A/B testing is not feasible because traffic is low, teams can still learn through funnel metrics, stronger hypotheses, qualitative research, and carefully chosen risk.
You are dying to run an A/B test on a website, product, app, or feature that you think could be improved. But user traffic is so low that running the test seems statistically unfeasible.
Has this happened to you? If not, it probably will. 🙂
Do not worry. In this edition of G&H, we will discuss what to do in situations like this.
A common limitation for people who want to run an A/B test is the number of people available to take part, meaning the traffic volume on the page, feature, or other place where the test will run.
That is because, as with any serious scientific experiment, an A/B test needs a minimum number of participants (traffic) to produce reliable results. Otherwise, you may draw conclusions from numbers that are only the result of chance. Just luck or bad luck.
What is a “reliable result”?
It is not my goal to get into the statistical details here (I am not a statistician, after all). But I will need to touch on a few essential concepts to avoid committing atrocities in experiments.
One of those concepts is statistical significance. Testing tools usually express it as a percentage from 0 to 100%.
Statistical significance indicates the percentage chance that the difference in conversion rate between the Control (“A”) and Variation (“B”) identified during an A/B test is “real” rather than the result of chance.
(Technically, the concept is a little more tedious. But that is not necessary for our discussion today.)
There is a common industry convention that a “reliable result” has statistical significance of at least 95%. In other words, there is a 5% chance that the result is just a matter of luck or bad luck.
How much traffic do I need to run a reliable A/B test?
This is a classic question with the traditional, depressing answer: it depends.
There is no exact number of visitors required for a reliable A/B test. The number of people needed depends on several variables.
Here are the main ones, with examples:
1. The conversion rate
The higher the conversion rate you want to optimize, the less traffic your test will need.
Here is an example using a VWO calculator:
The page we want to optimize gets 1,000 visits a day and has a 2% conversion rate. Under the scenario shown (which has another important variable that I will explain next), we would need 103 days (or 103,000 visitors) to reach a reliable result. An eternity.
But look at what happens when we optimize a page like this one with a 10% conversion rate:
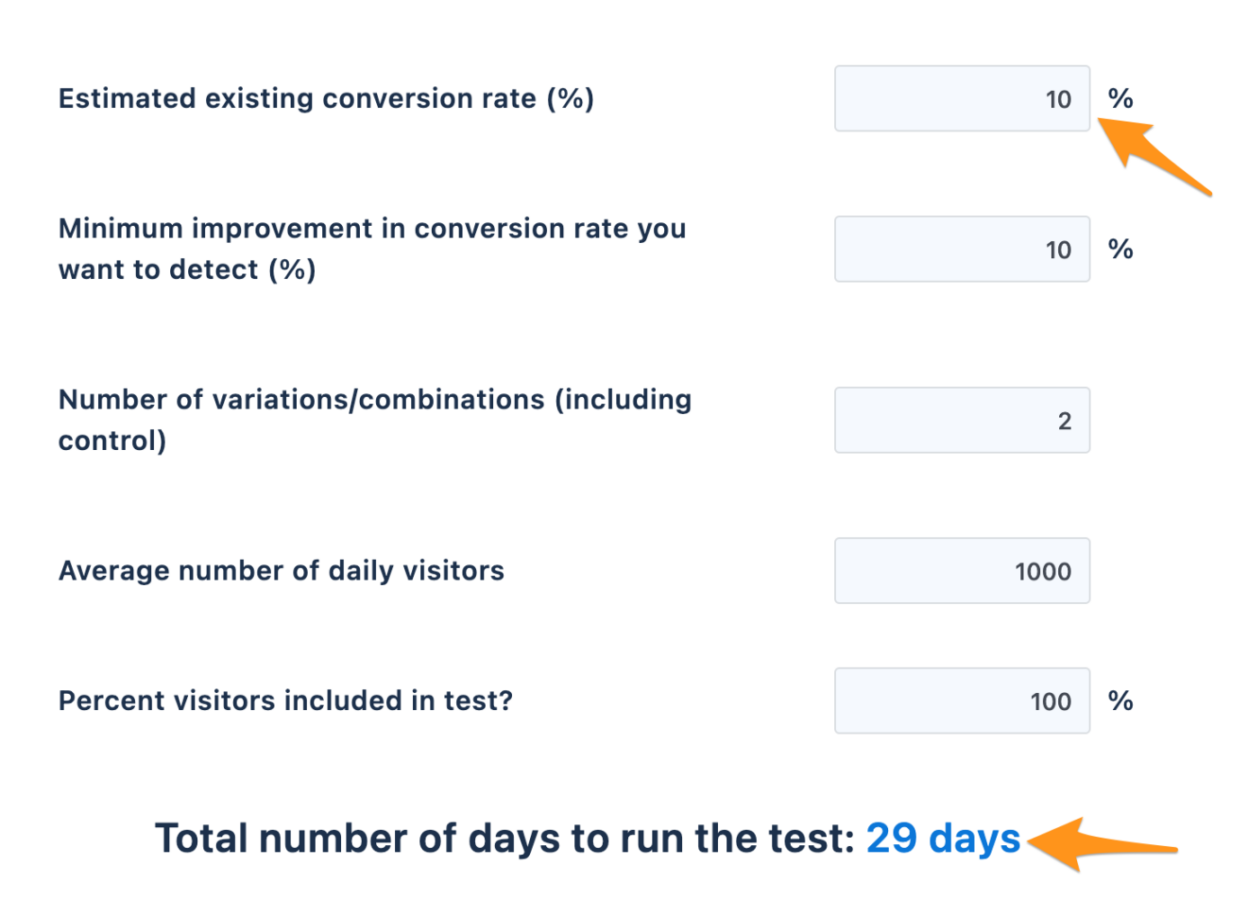
Just because this page has a higher conversion rate, the test duration (that is, the number of visits it needs to accumulate) drops sharply to 29 days (29,000 visitors).
2. The difference between A and B
The bigger the difference in conversion rate between A and B, the fewer visits are needed to reach a result with high statistical significance.
Let us look again at the scenario above. Notice the field “Minimum improvement in conversion rate you want to detect”:
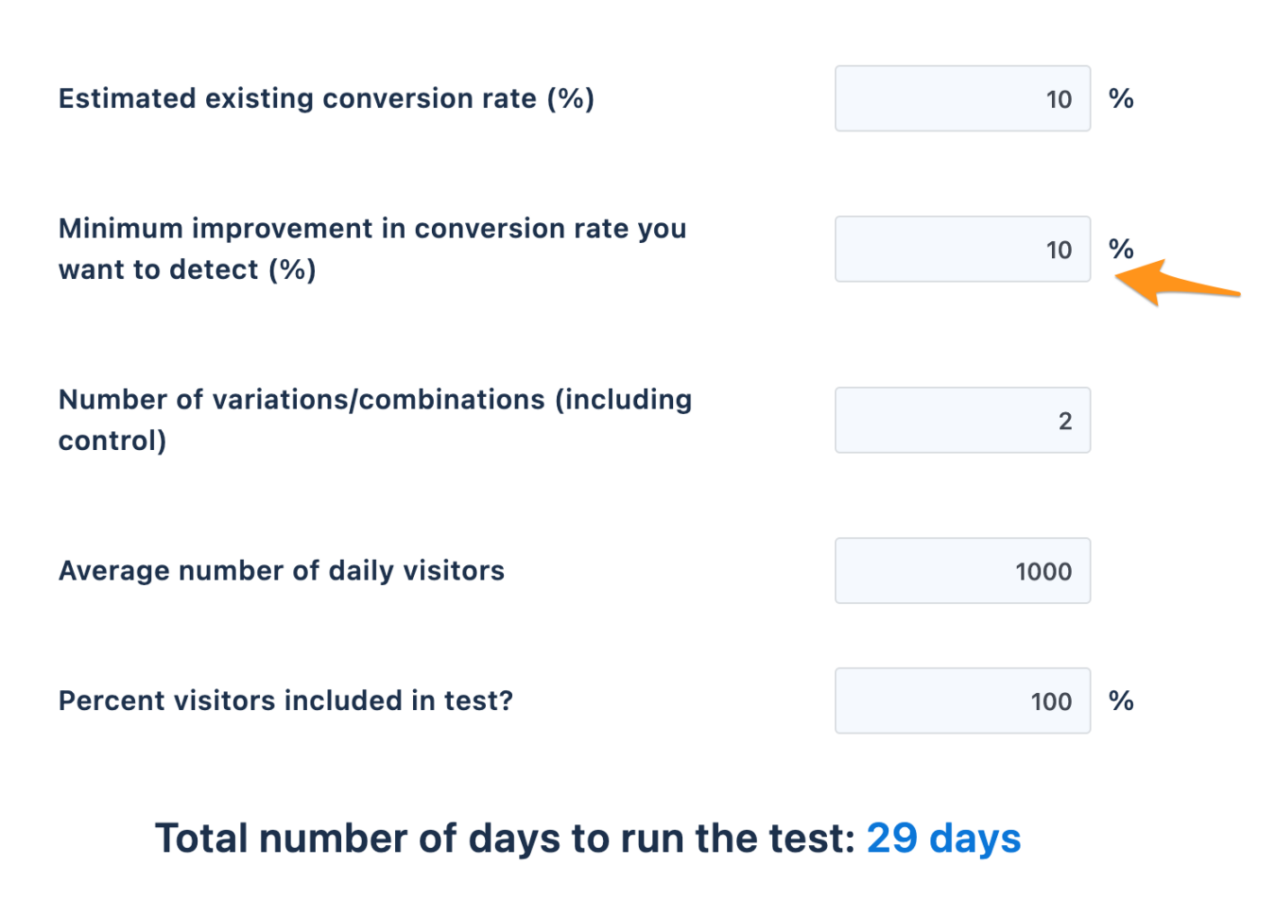
That “10%” means the test Variation must achieve at least a 10% improvement in conversion rate over the original page for the test to reach a reliable result in this scenario.
Any improvement below 10% will not be detected with statistical validity in the same period (or with the same traffic volume).
See what changes when we want to detect an increase of only 5% in conversion rate:
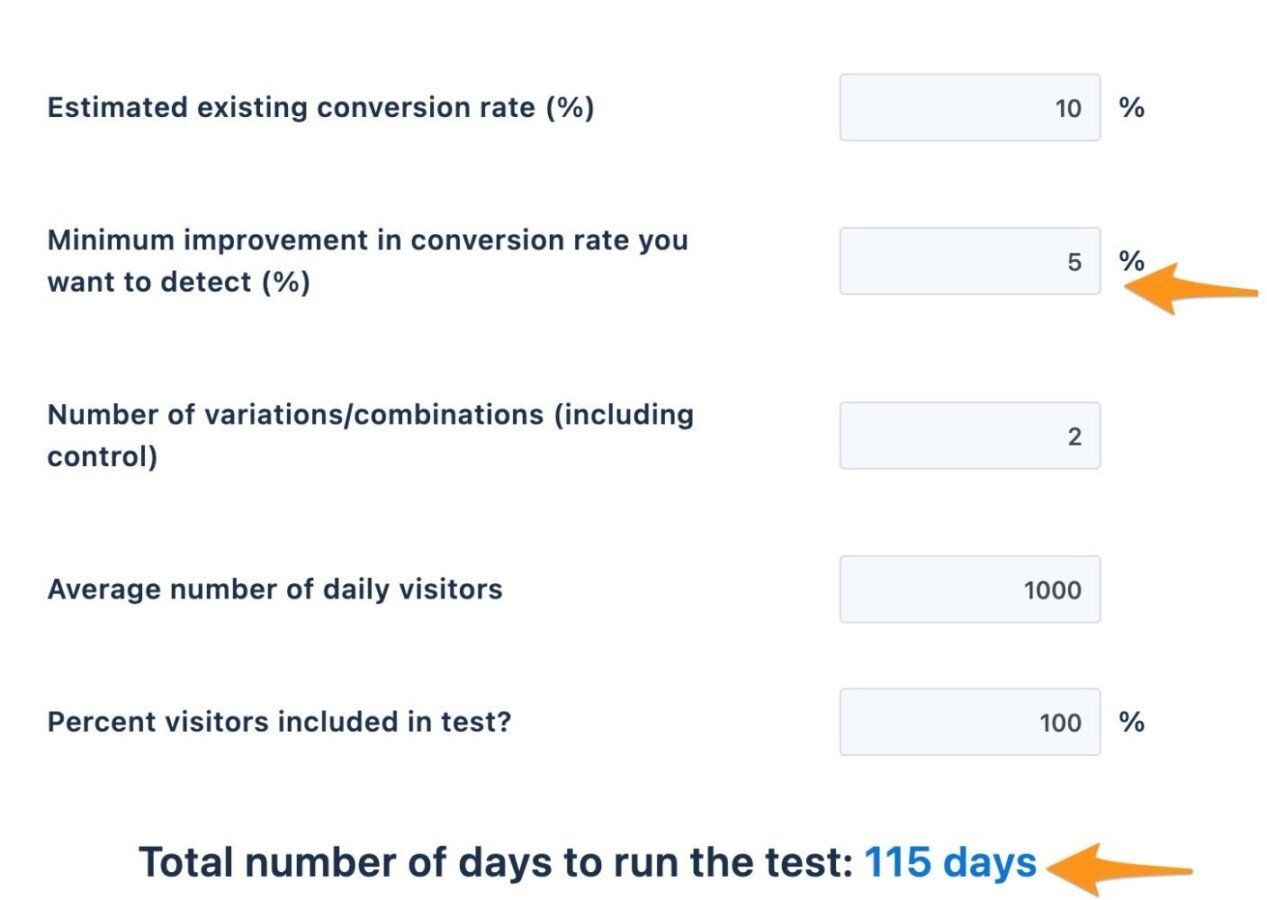
The time required for this test increases from 29 to 115 days (115,000 visitors).
On the other hand, if we only want to detect conversion increases of 20% or more, look what happens to the time and traffic required:
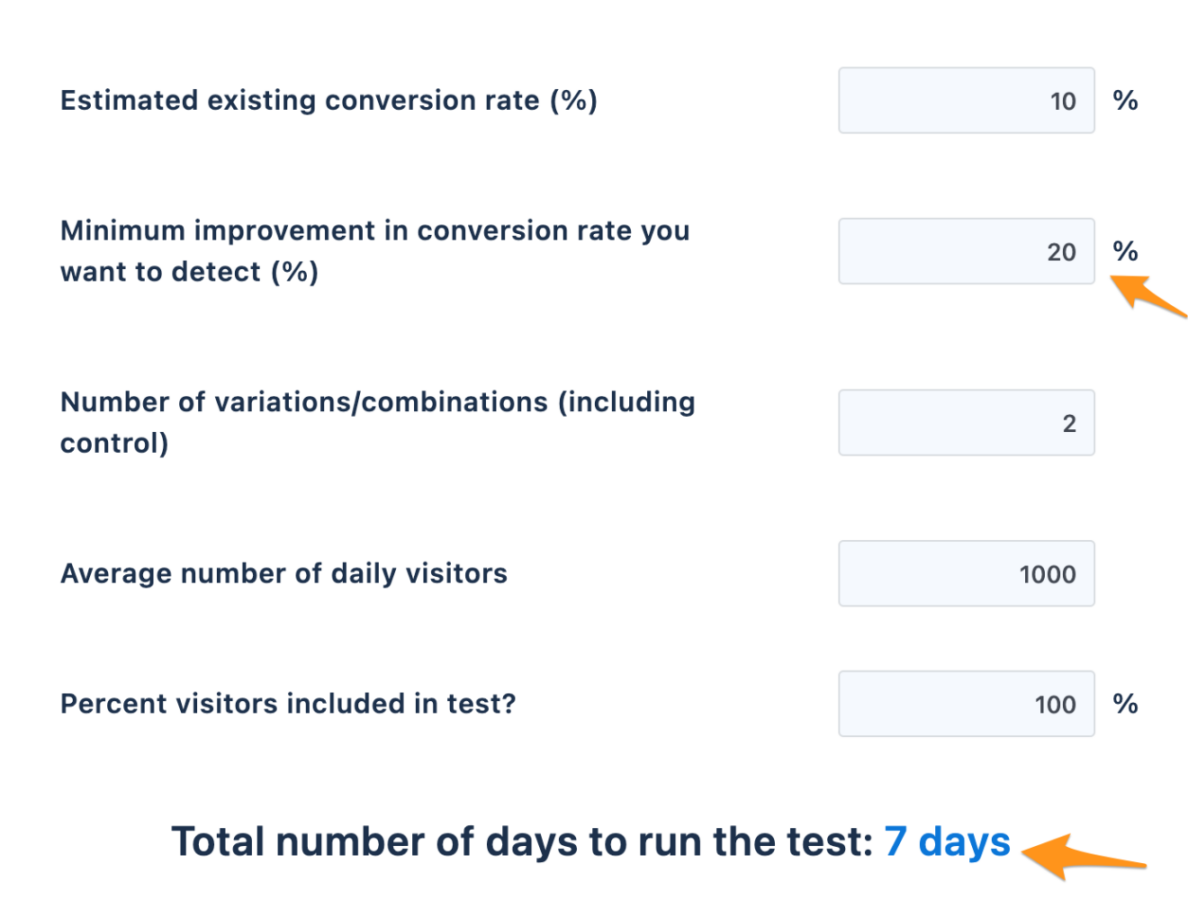
Yes, if conversion increases by 20%, we need only seven days to get a result with high statistical significance.
So how granular you want to be in detecting an improvement in your conversion rate is an important factor in deciding whether a test is feasible.
We will talk more about how to use this variable wisely below.
3. Statistical significance
Earlier, I said there is an industry convention that a “reliable” statistical significance (the chance that the result is not pure luck or bad luck) is 95%.
It is important to say that this 95% is only a general convention. There is nothing magical about it, and you should not follow it blindly. For example, some of the world’s best experimentation companies are quite satisfied with statistical significance of 90% or even less in most of their tests.
It all depends on how much risk you are willing to take when trusting the test result.
The opportunity cost of waiting to reach 95% significance can be very high. But if you are running a test that will inform a highly strategic decision for the company, you may indeed want a higher significance level.
In other words, your risk tolerance is one thing when testing ad copy and another when testing a new type of cancer diagnosis. Statistical significance of 95% is a useful reference, but it has some flexibility.
OK, it depends. But is there a rule of thumb?
I hope the examples above showed how much the traffic required for a test can vary. We changed the same test from 115,000 visitors to fewer than 7,000.
I know “it depends” is not a satisfying answer. So here is a general reference: a test tends to be feasible for interfaces that can provide at least a few thousand visits a month and 100 conversions per version (A, B, C, and so on).
But again, the best thing is to use a calculator like the one I showed and assess your specific situation.
Not everyone can run an A/B test. But everyone can do CRO.
As we have seen, not everyone (and not every area of a website or product) can run A/B tests feasibly. But please do not confuse the two things.
The fact that you cannot run an A/B test does not mean you cannot do CRO.
The whole CRO process of diagnosis, hypothesis building, and interface improvement still applies. The only difference is that, at the end, you will not have the convenience of validating the result with an A/B test.
Would it be ideal to run the test? Of course. I will not lie: as I have shown in other newsletter editions, no method is as precise as an A/B test for evaluating the results of a change.
But there are interesting strategies that can help with the apparent infeasibility of an A/B test.
Finally, let us get to them.
Strategy for low traffic #1: Use top-of-funnel conversions
In the best-case scenario, you will run experiments that measure your impact on the metric closest to revenue. For example, in e-commerce that metric would be revenue or transactions. On a lead-generation website, it could be completed forms or qualified leads.
The problem is that the further down the funnel a conversion is, the less often it happens. And as you already know, fewer conversions make a test harder to run.
But having few bottom-of-funnel conversions is no reason not to test. You can get many benefits from running tests that measure earlier funnel steps, where conversions are naturally more frequent.
There is nothing wrong with an e-commerce business that cannot test transactions using add-to-cart events or checkout starts as its goal instead.
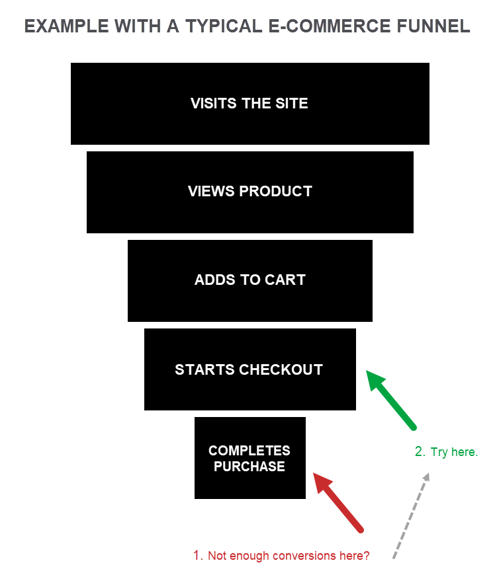
Even though it is not the perfect scenario, there is usually a strong correlation between an increase in conversion at one funnel step and the steps that follow.
Strategy for low traffic #2: Use as few variations as possible
When we are excited about building a new page version for an A/B test, ideas for variations can quickly turn that test into an ABC, ABCD, ABCDEFG...Z. Right?
After all, maybe the blue button you are making would look better in purple. And would image X or Y work better below? And so on.
Many people who have worked with me know I always push back against this temptation.
The simple reason is that the more variations there are, the more traffic the test needs to reach statistical significance.
Here is a simple table showing the traffic required to reach 95% statistical significance for a 10% increase on a website with a 5% conversion rate:
| Versions in the test | Traffic needed for 95% significance |
|---|---|
| 2 (AB) | 61,000 |
| 3 (ABC) | 91,000 |
| 4 (ABCD) | 122,000 |
And usually the differences between versions X, Y, and Z of the new page are small things that will not produce a relevant improvement on 99.9% of websites.
If your traffic is low, give this strategy serious consideration. Do everything you can to limit tests to just two versions: the original and the variation.
Obviously, there are sometimes excellent reasons to run an ABC, ABCD, and so on. For example, when there is a genuinely significant difference in the experience users will have in each version of the variation.
But in other cases, adding more variations to an A/B test is usually a waste of time and money.
Strategy for low traffic #3: Improve your odds by grounding your tests
On a low-traffic website, you cannot “be Booking.com” and run 1,000 tests at once. Your pace will necessarily be slower.
And because you cannot run many tests over the course of the year, every one of them matters.
So make sure your test ideas are grounded in reliable data, whether from Analytics, user interviews, research, and so on. This increases the chance that each test will bring positive results.
Losing a test is not necessarily terrible. When tests are well run, even a loss can produce more valuable learning than many wins.
But if you only run a few tests a year, you really cannot afford to lose 90% of them.
Strategy for low traffic #4: Run bolder tests
With little traffic, you cannot afford to run tests with small changes that might increase conversion by 0.5% or 1%. Remember: the smaller the conversion impact, the more traffic is required to reach statistical significance.
So be bold and run tests with more substantial changes.
It is fun to see case studies where Google or Facebook changed a button from one color to another and increased conversion. But on a smaller website, it is very likely that you will not be able to identify any change from a test like that.
(Unless the current button color is actually making the experience difficult for users, which usually is not the case. Usually, it is a conversation about color psychology or something similar that gives birth to inconclusive tests.)
The impact will be too small to identify with statistical significance.
Instead, combine this strategy with Strategy #3. Identify the problems or doubts that keep visitors from converting. Then try to solve them with changes that are really strong enough to persuade someone who would not otherwise buy.
When you get it right, this strategy gives you a much greater chance of making a considerable impact on the conversion rate (one large enough to reach statistical significance).
Strategy for low traffic #5: Validate changes qualitatively
If traffic is so low that you really cannot run a test, even with the ideas above, you can borrow an alternative practice from Product Discovery teams.
Create your Variation and recruit a few users to try it, as in usability testing. See whether what you planned actually happens for those users. Ask questions about the details of their experience.
Another option that can scale a little more is to publish your Variation in an A/B test so some users can experience it. Then you can record their interactions with the page through Analytics tools (such as Google Analytics) and session-recording tools (such as Hotjar).
This test still will not reach statistical significance, but you will get a useful number of interactions with the new page and can try to gather insights.
It is important to be very clear: neither of these methods comes close to A/B testing in precision and reliability.
But if you do not have enough traffic to test, these methods are much more efficient and data-driven than simply publishing your changes and hoping they work.
Strategy for low traffic #6: Consider lowering the statistical significance you accept
As we have seen, 95% statistical significance is a market “standard,” but it is not magic. You do not have to follow it blindly.
In practice, the rule for making decisions from test results is: the lower the statistical significance, the higher the risk that the result you see is just due to chance.
Put roughly, if one of your Variations wins with 80% statistical significance, there is a 20% chance the result is “false.” If you are comfortable with that risk, go ahead! Declare the Variation the winner, publish it permanently, and move on to the next test.
Conclusion
By following the strategies in this article, many websites, products, and areas that at first seem “untestable” can start using experimentation to improve performance in a much more data-driven way than simply “changing things and seeing what happens.”
If, like most people, you do not have the virtually unlimited traffic of Big Tech companies, always look for ways to get as close as possible to the scientific method for experiments in your situation. Often, you will find solutions that, even if they are not the “gold standard” of science (an A/B test, or randomized controlled experiment), can still help you make smarter decisions. Respect the scientist inside you.